The U.S. Counties Where the Most Rideshare and Taxi-Related Fatalities Occur
Many of us have had unsettling experiences in the back of a cab or have witnessed the erratic driving of taxis, Lyfts, and Ubers during rush hour. So, how often do taxi drivers get into accidents? While taxi drivers typically have a lower crash rate per mile than the average driver, their total accident involvement can be higher due to long hours, distractions, and the tendency to speed—after all, time is money in this business.
Are rideshares dangerous? A 2024 study published in the Journal of Safety Research found that a staggering one-third of rideshare drivers have been involved in a crash while working. Factors such as cellphone use, driving while fatigued, and navigating unfamiliar roads have increased the likelihood of these accidents. Additionally, a study from Columbia University found that ride-hailing services are linked to an increase in crashes involving motorists and pedestrians around pickup and drop-off locations.
As the rideshare profession is relatively new, information regarding its safety is still developing. However, there is a clear risk when relying on third-party transportation in traffic systems that may not be adequately equipped. The team at Blume Forte has analyzed taxi and rideshare fatality data from the National Highway Traffic Safety Administration to help raise awareness and highlight areas that require attention. Take a look:
Where Do Most Taxi Accidents Happen?
New York City has four of the top ten counties with the highest number of fatal accidents involving taxis or rideshares, making it one of the most dangerous cities for taxi-related incidents. However, New York City is home to 13,587 licensed yellow cabs, the highest number of any city in the country. When including other taxis, Ubers, and Lyfts, the total number of rideshare vehicles in New York City exceeds 90,000—a figure that has increased exponentially in the past decade.
The large volume of taxis and the high frequency of trips have undoubtedly contributed to New York’s ranking as the city with the most rideshare fatalities in America. While every death and injury is significant, a more accurate way to assess the safety of rideshares in a particular region is by examining the per capita rate of taxi accidents. More on that below.
Atlantic County, New Jersey – Atlantic City
Atlantic County, New Jersey, which is home to Atlantic City, has the highest frequency of fatal taxi accidents. Between 2019 and 2023, there were six deaths in the county, resulting in a fatality rate of 21.67 per 1,000,000 people.
Why are rideshare accidents so frequent in Atlantic County? The issue is multifaceted. Atlantic City is home to an international airport that draws traffic from taxis and rideshares. While rideshare services provide convenience for travelers, the dramatic rise in their usage for airport transportation has led to infrastructure challenges that can compromise safety.
According to Rutgers University, the Transportation Network Companies (TNCs) like Uber and Lyft have contributed to “landslide congestion” at airport facilities, exacerbating the already high-stress environments of arrivals and departures. Factors such as narrow lanes, confusing signage, tight timelines, and limited room for error can increase the potential for accidents.
In addition to Atlantic County, other counties in New Jersey also report high rates of taxi and rideshare accidents. Essex County, which includes Newark, ranks 14th for the highest fatality rate per 1,000,000 people and 10th for deaths overall. Hudson County, home to Jersey City, ranks 22nd with six total deaths. Unfortunately, these taxi and rideshare fatality statistics reflect broader traffic accident trends in New Jersey. Between 2023 and 2024, traffic fatalities increased by 14%, while pedestrian fatalities rose by 32%.Fortunately, there may be hope for improving safety for drivers and pedestrians in New Jersey. In January 2025, Governor Phil Murphy signed legislation establishing the Target Zero Commission. This multi-department initiative aims to eliminate traffic deaths and serious injuries in New Jersey by 2040. Every saved life and avoided injury is a significant victory.
How to Be Safe in a Taxi
Although you can’t entirely avoid taxi and rideshare accidents, there are several steps you can take to enhance your safety before and during a ride. Here are some resources on taxi and rideshare safety that can help you prepare for a safe and efficient journey to your destination:
- Tips to Stay Safe While Ridesharing
- Protect Your Safety While Riding With Uber
- Taxi Safety Tips: What Every Passenger Should Know
- 7 Safety Tips for Riding Uber and Lyft
The danger in rideshare services often comes not only from traffic but also from the drivers themselves. Between 2017 and 2022, Uber received 400,181 reports of sexual assault or misconduct in the U.S., averaging one incident every eight minutes. While millions of taxi and rideshare rides are safe and successful, more efforts are needed to address the thousands of cases that fail to protect passengers. Since 1929, Blume Forte’s attorneys have dedicated themselves to advocating for those who have been wronged and will continue to do so as long as necessary.
The U.S. Counties With the Highest Number of Rideshare and Taxi-Related Fatalities
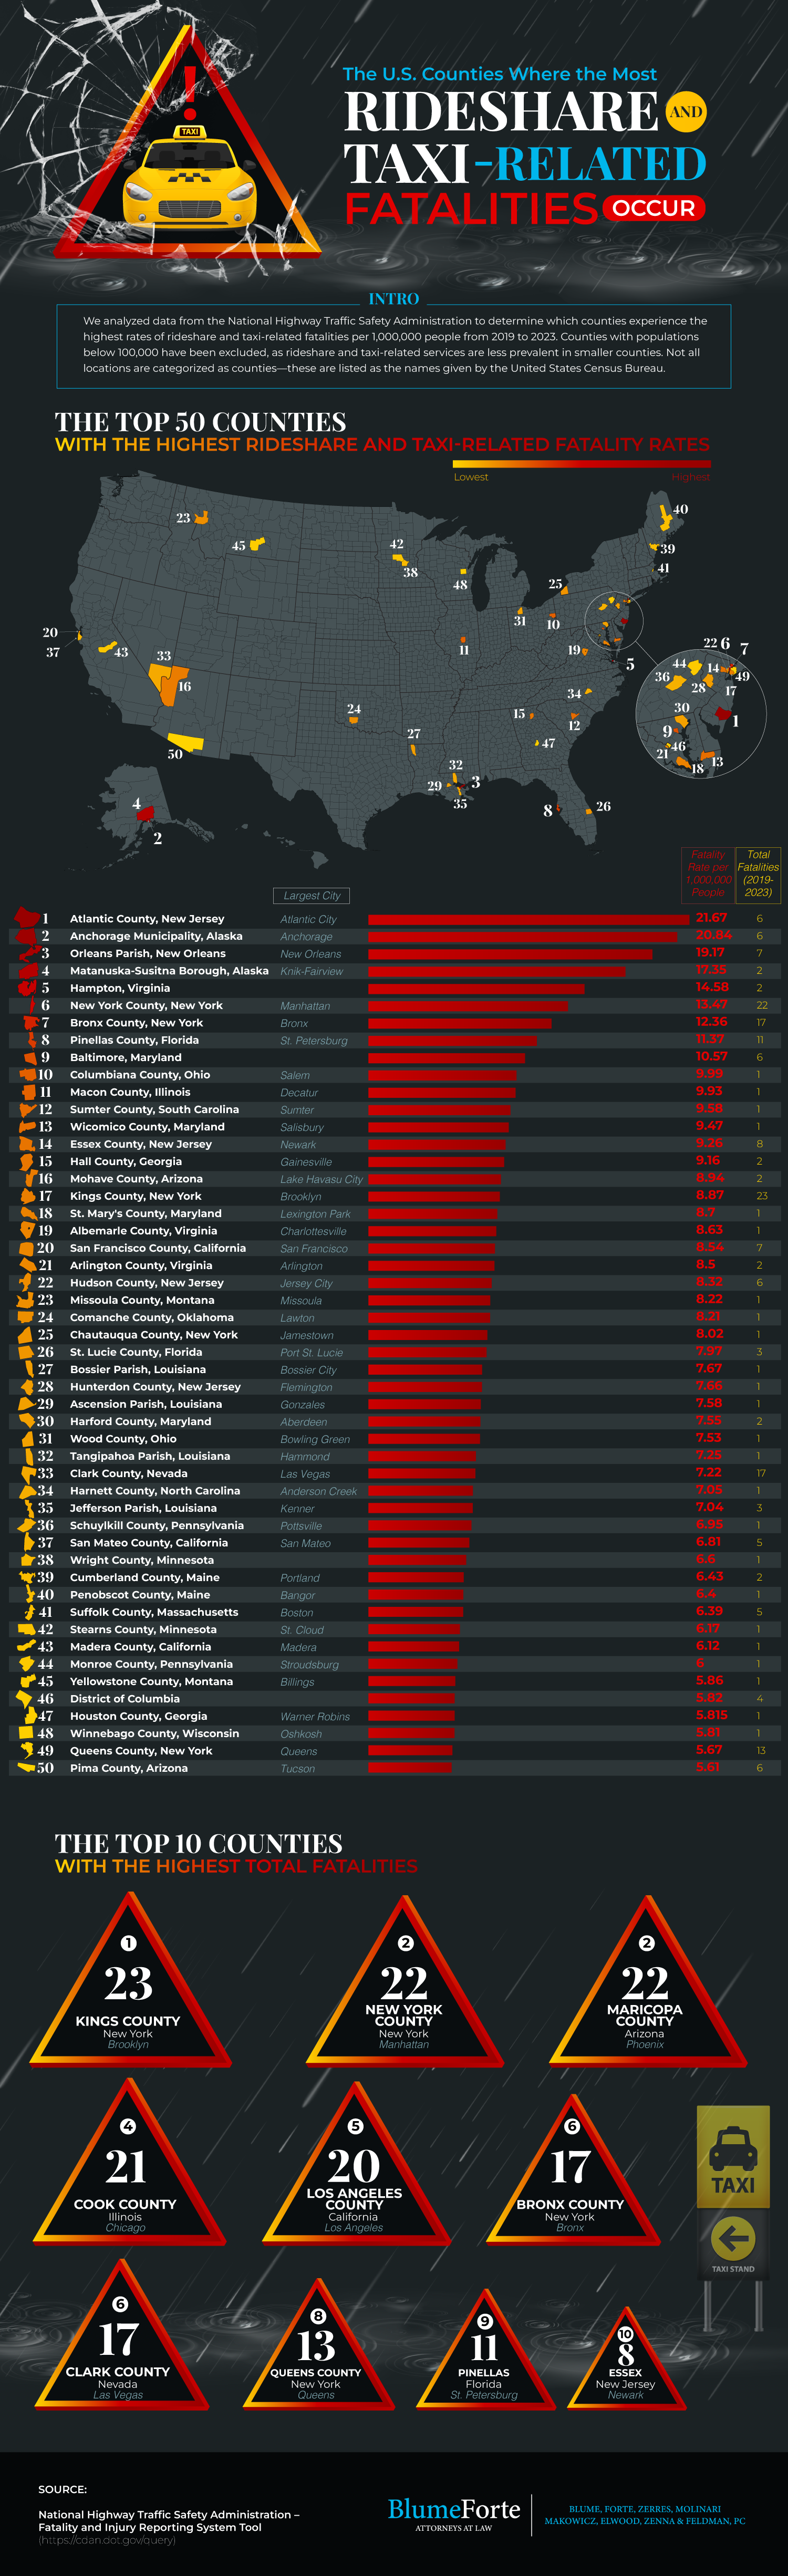
We analyzed data from the National Highway Traffic Safety Administration to determine which counties experience the highest rates of rideshare and taxi-related fatalities per 1,000,000 people from 2019 to 2023. Counties with populations below 100,000 have been excluded, as rideshare and taxi-related services are less prevalent in smaller counties. Not all locations are categorized as counties—these are listed as the names given by the United States Census Bureau.
The Top 25 Counties With the Highest Rideshare and Taxi-Related Fatality Rates
| County + Largest City | Fatality Rate (per 1,000,000 People) | Total Fatalities (2019–2023) |
|---|---|---|
| Atlantic County, New Jersey (Atlantic City) | 21.67 | 6 |
| Anchorage Municipality, Alaska (Anchorage) | 20.84 | 6 |
| Orleans Parish, Louisiana (New Orleans) | 19.17 | 7 |
| Matanuska-Susitna Borough, Alaska (Knik-Fairview) | 17.35 | 2 |
| Hampton, Virginia | 14.58 | 2 |
| New York County, New York (Manhattan) | 13.47 | 22 |
| Bronx County, New York (Bronx) | 12.36 | 17 |
| Pinellas County, Florida (St. Petersburg) | 11.37 | 11 |
| Baltimore, Maryland | 10.57 | 6 |
| Columbiana County, Ohio (Salem) | 9.99 | 1 |
| Macon County, Illinois (Decatur) | 9.93 | 1 |
| Sumter County, South Carolina (Sumter) | 9.58 | 1 |
| Wicomico County, Maryland (Salisbury) | 9.47 | 1 |
| Essex County, New Jersey (Newark) | 9.26 | 8 |
| Hall County, Georgia (Gainesville) | 9.16 | 2 |
| Mohave County, Arizona (Lake Havasu City) | 8.94 | 2 |
| Kings County, New York (Brooklyn) | 8.87 | 23 |
| St. Mary’s County, Maryland (Lexington Park) | 8.70 | 1 |
| Albemarle County, Virginia (Charlottesville) | 8.63 | 1 |
| San Francisco County, California (San Francisco) | 8.54 | 7 |
| Arlington County, Virginia (Arlington) | 8.50 | 2 |
| Hudson County, New Jersey (Jersey City) | 8.32 | 6 |
| Missoula County, Montana (Missoula) | 8.22 | 1 |
| Comanche County, Oklahoma (Lawton) | 8.21 | 1 |
| Chautauqua County, New York (Jamestown) | 8.02 | 1 |
| St. Lucie County, Florida (Port St. Lucie) | 7.97 | 3 |
| Bossier Parish, Louisiana (Bossier City) | 7.67 | 1 |
| Hunterdon County, New Jersey (Flemington) | 7.66 | 1 |
| Ascension Parish, Louisiana (Gonzales) | 7.58 | 1 |
| Harford County, Maryland (Aberdeen) | 7.55 | 2 |
| Wood County, Ohio (Bowling Green) | 7.53 | 1 |
| Tangipahoa Parish, Louisiana (Hammond) | 7.25 | 1 |
| Clark County, Nevada (Las Vegas) | 7.22 | 17 |
| Harnett County, North Carolina (Anderson Creek) | 7.05 | 1 |
| Jefferson Parish, Louisiana (Kenner) | 7.04 | 3 |
| Schuylkill County, Pennsylvania (Pottsville) | 6.95 | 1 |
| San Mateo County, California (San Mateo) | 6.81 | 5 |
| Wright County, Minnesota | 6.60 | 1 |
| Cumberland County, Maine (Portland) | 6.43 | 2 |
| Penobscot County, Maine (Bangor) | 6.40 | 1 |
| Suffolk County, Massachusetts (Boston) | 6.39 | 5 |
| Stearns County, Minnesota (St. Cloud) | 6.17 | 1 |
| Madera County, California (Madera) | 6.12 | 1 |
| Monroe County, Pennsylvania (Stroudsburg) | 6.00 | 1 |
| Yellowstone County, Montana (Billings) | 5.86 | 1 |
| District of Columbia | 5.82 | 4 |
| Houston County, Georgia (Warner Robins) | 5.82 | 1 |
| Winnebago County, Wisconsin (Oshkosh) | 5.81 | 1 |
| Queens County, New York (Queens) | 5.67 | 13 |
| Pima County, Arizona (Tucson) | 5.61 | 6 |
The Top 10 Counties With the Highest Total Fatalities
- New York – Kings County – 23 (Brooklyn)
- New York – New York County – 22 (Manhattan)
- Arizona – Maricopa County – 22 (Phoenix)
- Illinois – Cook County – 21 (Chicago)
- California – Los Angeles County – 20 (Los Angeles)
- New York – Bronx County – 17 (Bronx)
- Nevada – Clark County – 17 (Las Vegas)
- New York – Queens County – 13 (Queens)
- Florida – Pinellas – 11 (St. Petersburg)
- New Jersey – Essex – 8 (Newark)
Source: National Highway Traffic Safety Administration – Fatality and Injury Reporting System Tool https://cdan.dot.gov/query
Embed this infographic on your website: